
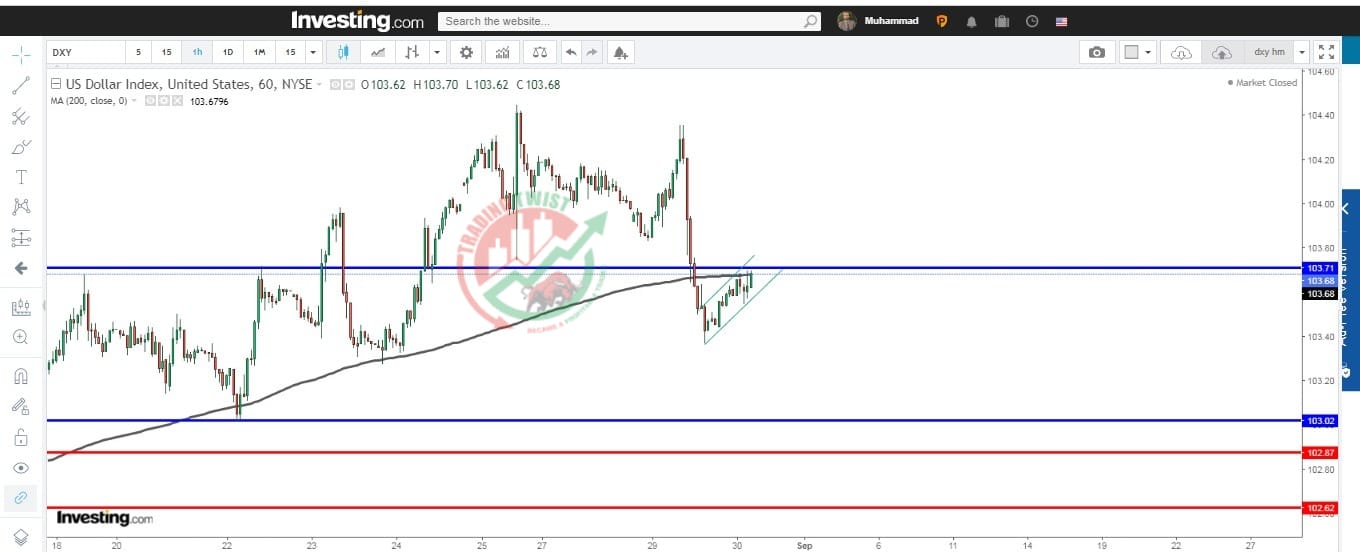
US Index Chart Technical Outlook Index regains composure near 103.70 ahead of key data
•The index bounces off recent lows and regains 103.70.
•US yields attempt a mild rebound across the curve.
•Flash Q2 GDP Growth Rate, ADP report takes center stage.
USD Index relevant levels
Now, the index is gaining 0.19% at 103.68 and the breakout of 104.44 (monthly high August 25) would open the door to 104.69 (monthly high May 31) and finally 105.88 (2023 high March 8). On the downside, immediate support emerges at 103.07 (200-day SMA) followed by 102.34 (55-day SMA), and then 101.74 (monthly low August 4).


