
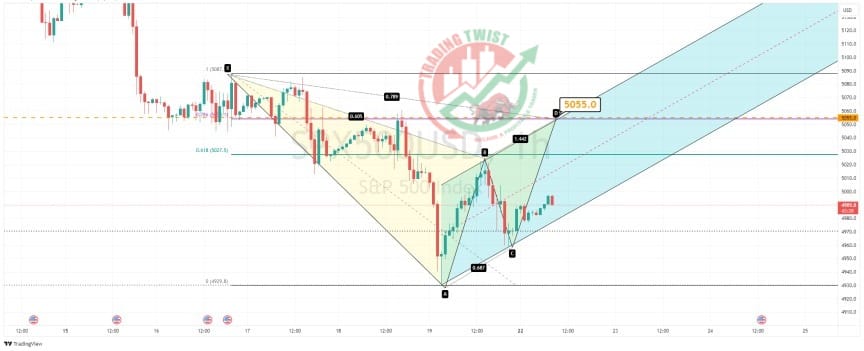
S&P 500 US500 Chart Technical Outlook 261.8% extension level located at 4,928
We have a 261.8% extension level located at 4,928. Elliot Wave enthusiasts may look to this as the completion of a bearish 5 wave count. That would indicate that we have a choppy but corrective 3-wave formation higher.
The intraday chart highlights the index moving higher within a bullish channel formation. Bespoke resistance is located at 5,055. The 78.6% pullback level from the last decline is located at 5,054.
Conclusion: Although the intraday bias is mildly bullish, I would look for the completion of a Gartley formation at 5,055. Expect trading to remain mixed and volatile.


