
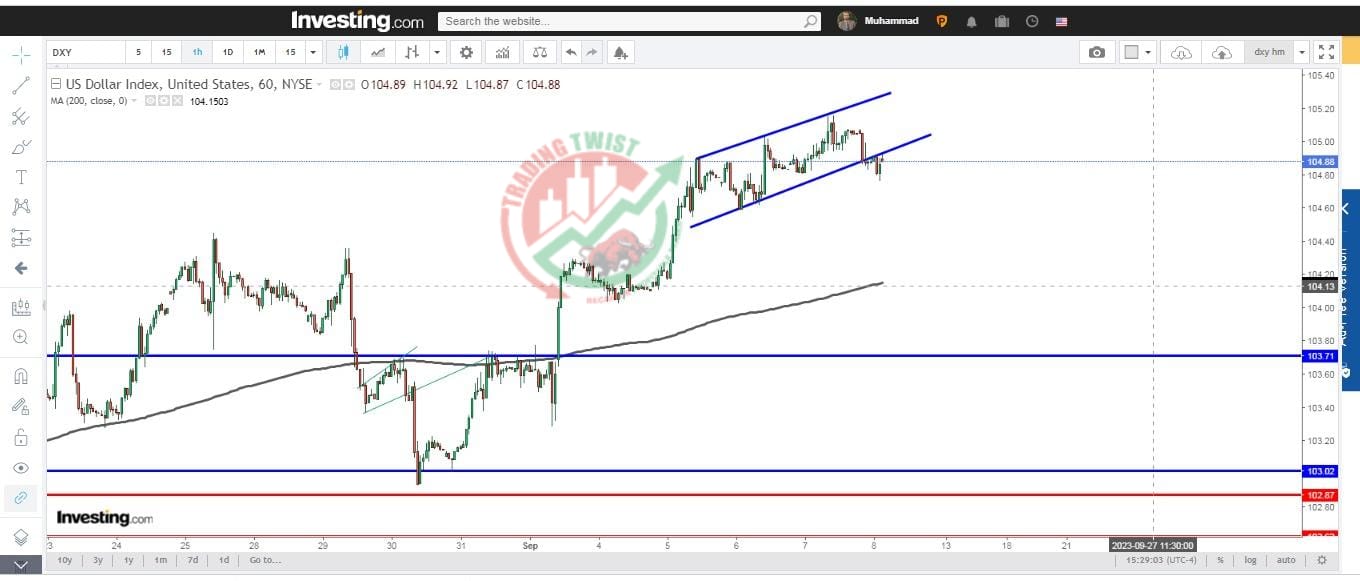
The USD Index DXY Chart Technical Outlook touched a fresh multi-month high of 105.15 on Thursday after the data from the US showed that the weekly Initial Jobless Claims declined to 216,000 in the week ending September 2 from 229,000. Meanwhile, the Bureau of Labor Statistics revised the second-quarter Unit Labor Costs to +2.2% from +1.6% in the initial estimate. Early Friday, DXY stayed in negative territory below 105.00 and US stock index futures traded in positive territory, pointing to an improving risk mood.


