
WTI struggles to extend two-day rebound, sidelined of late.
•Bullish MACD signals, sustained trading above 200-EMA and one-week-old previous resistance line keep Oil buyers hopeful.
•Double bottom around $76.68 puts a floor under Commodity price.
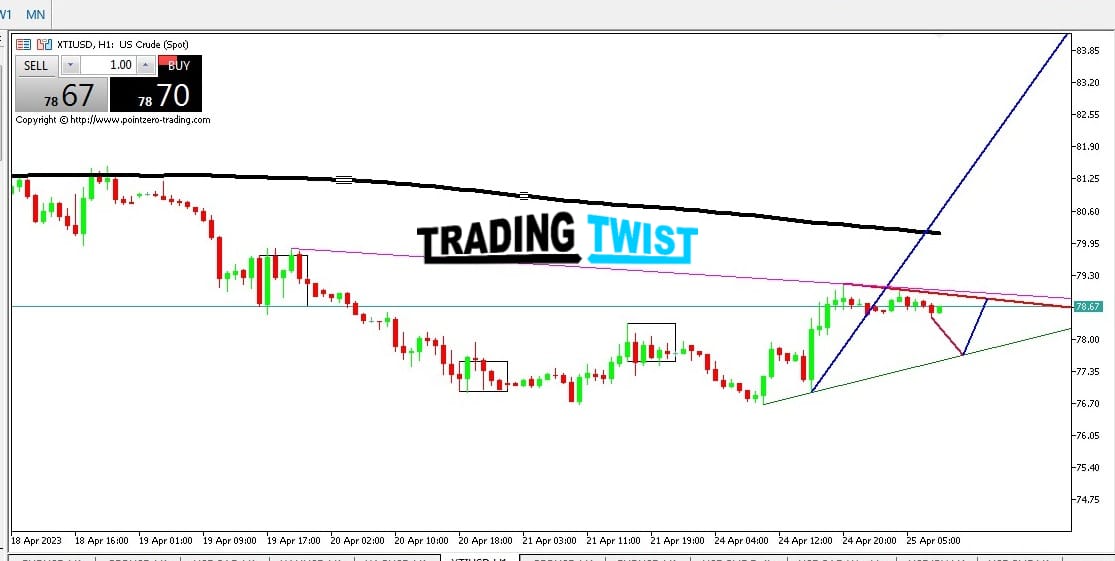
WTI crude oil treads water around $78.70, pausing a two-day uptrend, as the market seeks fresh clues during early Tuesday. In doing so, the black gold makes rounds to the 100-bar Exponential Moving Average (EMA).
Although the energy benchmark seesaws around the short-term key EMA, its ability to stay beyond the 200-EMA level of $77.70, joins the bullish MACD signals to keep Oil buyers hopeful.
Also favoring the WTI bulls is the quote’s successful break of the previous resistance line from April 14, now immediate support near $78.20.
Additionally, the confirmation of a “Double bottom” bullish chart formation, via a sustained break of $78.30 trigger-point, adds strength to the bullish bias surrounding the WTI crude oil.
With this, the WTI crude oil buyers are wel


