
Analyzing the technical outlook of the BTC (Bitcoin) chart involves studying price movements, chart patterns, and technical indicators to gain insights into potential future price direction.
BTC delays inevitable crash to $25,000
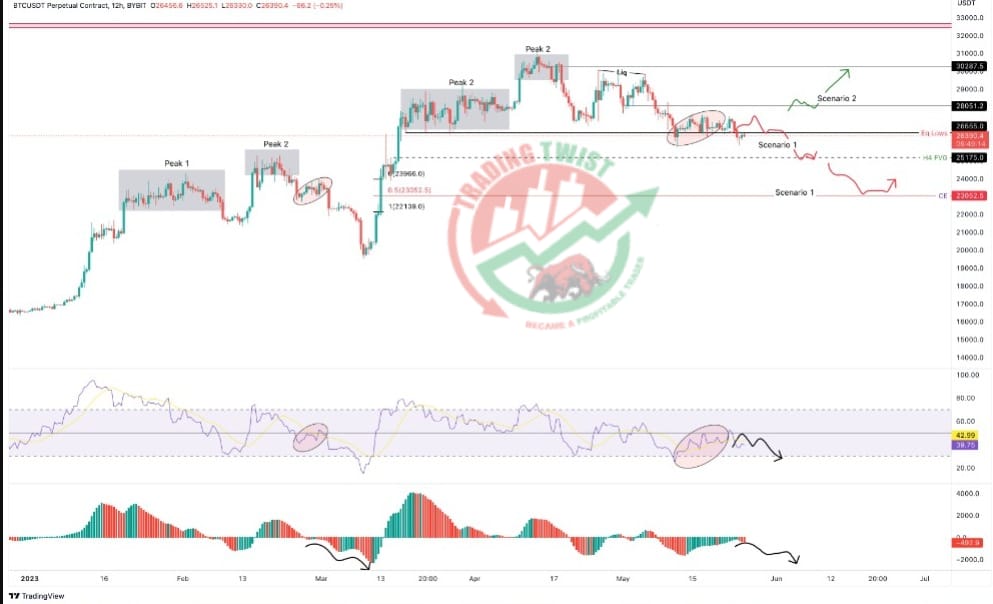
Bitcoin price seems ready to collapse and is awaiting a strong push to kick-start its nosedive.
The $26,555 and $25,175 support levels are key for bulls to seize control from sellers.
Invalidation of the bearish outlook will occur if BTC manages to flip the $28,051 hurdle into a support floor.
It’s important to note that Bitcoin’s price action can be highly volatile and subject to rapid changes. Therefore, risk management is crucial when trading or investing in Bitcoin. Implementing appropriate risk management strategies such as setting stop-loss orders, managing position sizes, and understanding the risk-reward ratio can help navigate the market effectively.
It’s worth mentioning that technical analysis alone may not provide a complete picture of Bitcoin’s price movements. Considering fundamental factors, market sentiment, and regulatory developments alongside technical analysis can help traders and investors make well-informed decisions in the cryptocurrency market.


