The Relative Strength Index, or RSI, is a popular technical analysis indicator used by traders to measure the momentum of an asset. It was developed by J. Welles Wilder in the late 1970s and has since become a widely used tool in the world of trading.
The RSI is a charting tool that measures the strength of an asset’s price action by comparing the size of its gains to the size of its losses over a specified period of time. This measurement is then plotted on a scale of 0 to 100, with the RSI typically appearing below the asset’s price chart.
How is the RSI calculated?
The Relative Strength Index (RSI) is calculated by comparing the size of gains to the size of losses over a specified period of time. The RSI calculation involves dividing the average gain of an asset over a given period of time by the average loss over the same period, and then plotting the result on a scale of 0 to 100.
The RSI is calculated by dividing the average gain of an asset over a specified period of time by the average loss over the same period. The result is then plotted on a scale of 0 to 100. The Relative Strength Index is typically calculated using a 14-period time frame, although traders can adjust this based on their individual preferences.
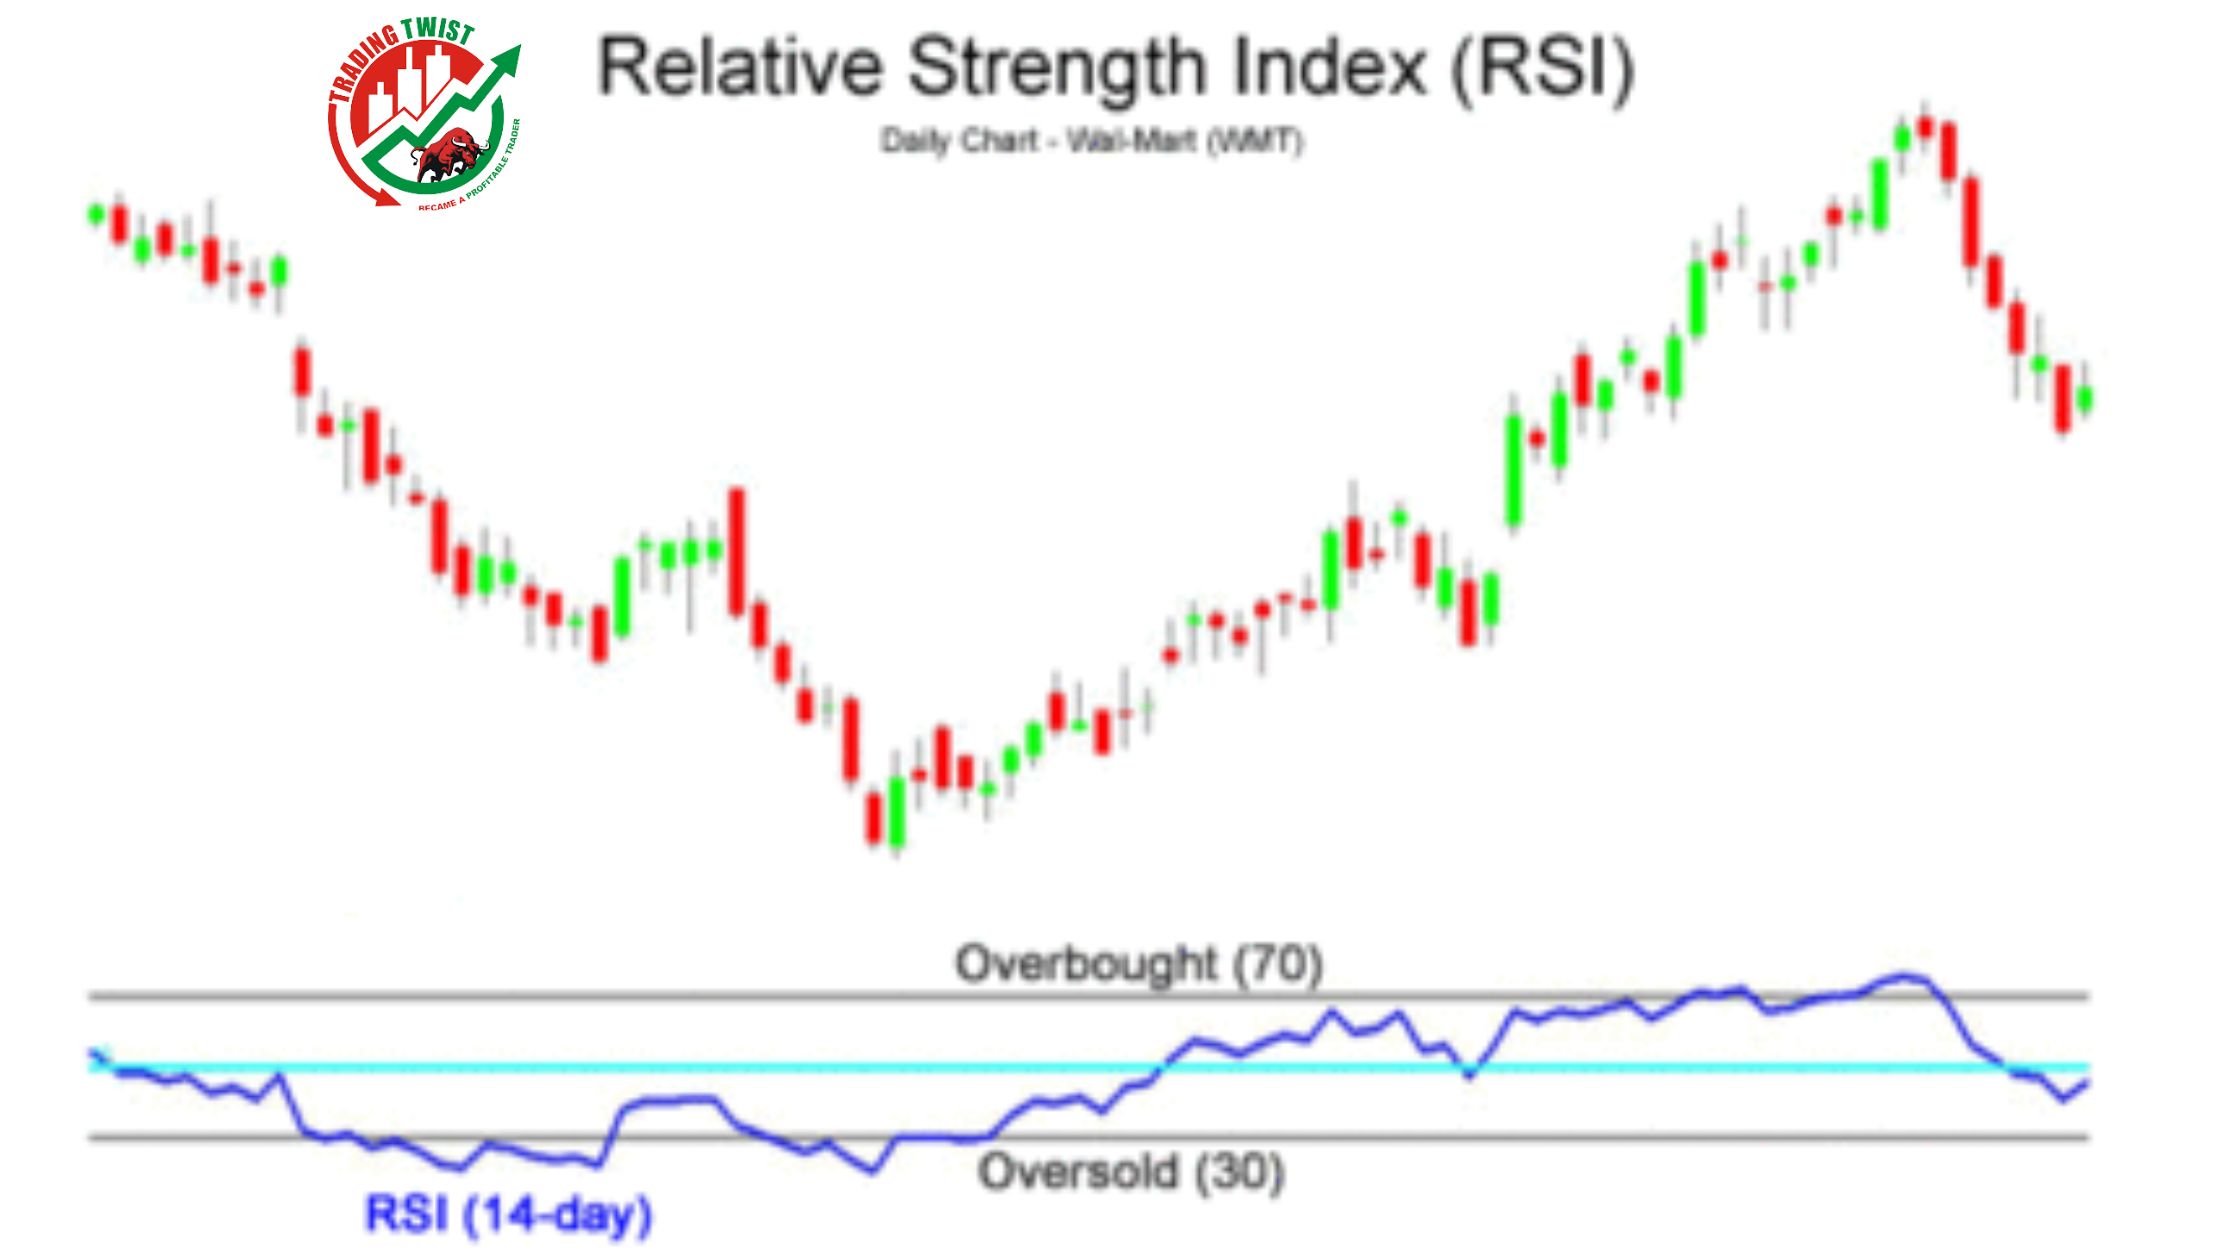
Interpreting RSI readings: Overbought and oversold
A reading above 70 on the RSI is typically considered overbought, indicating that the asset may be due for a price correction or reversal. Conversely, a reading below 30 is considered oversold, indicating that the asset may be due for a price bounce or reversal.
Interpreting RSI readings is a crucial aspect of using this technical analysis tool effectively. Relative Strength Index readings typically range from 0 to 100, with readings above 70 considered overbought, and readings below 30 considered oversold. An overbought reading indicates that an asset’s price may have risen too far, too fast, and may be due for a price correction or reversal.
Conversely, an oversold reading suggests that an asset’s price may have fallen too far, too fast, and may be due for a price bounce or reversal. By understanding these overbought and oversold readings, traders can use the RSI as a potential signal to buy or sell an asset or to confirm trends or potential entry or exit points.
Using the RSI for trading signals
Traders can use the RSI in a number of ways. For example, a trader might use an overbought reading on the RSI as a signal to sell an asset, while an oversold reading might be used as a signal to buy. Alternatively, traders might use the Relative Strength Index to confirm trends or to identify potential entry or exit points.
The RSI can be a powerful tool for generating trading signals. Traders can use the overbought and oversold readings on the RSI to potentially identify trading opportunities. For example, when the RSI is above 70 and indicates that an asset is overbought, traders may consider selling the asset in anticipation of a price correction or reversal. Conversely, when the Relative Strength Index is below 30 and indicates that an asset is oversold, traders may consider buying the asset in anticipation of a price bounce or reversal.
Additionally, traders can use the RSI to identify potential entry or exit points. For example, a trader might look for a bullish divergence between the Relative Strength Index and the asset’s price chart, which could indicate a potential price reversal and a potential buying opportunity. Similarly, a bearish divergence could indicate a potential price reversal and a potential selling opportunity.
Using RSI in Isolation
It’s important to note that the RSI should not be used in isolation and should be combined with other technical analysis tools and fundamental analysis to confirm trading signals. Traders should also be aware of false signals, which can occur when the Relative Strength Index gives conflicting signals with other indicators or when the asset is experiencing unusual price movements.
Overall, using the RSI for trading signals can be an effective way to identify potential buying and selling opportunities, as well as to confirm trends and potential entry or exit points. By incorporating the Relative Strength Index into their trading strategies, traders can potentially improve their profitability and make more informed trading decisions.
One of the advantages of the Relative Strength Index is that it can be used in conjunction with other technical analysis indicators. For example, traders might use the RSI alongside moving averages or trend lines to confirm signals or to identify potential areas of support or resistance.
It’s worth noting that the RSI is just one tool in a trader’s arsenal, and should be used in conjunction with other technical and fundamental analysis tools. Additionally, traders should be aware that the RSI, like all technical indicators, is not foolproof and can produce false signals.
Conclusion
In conclusion, the Relative Strength Index is a powerful tool that can help traders identify potential price reversals and entry or exit points. By understanding how the Relative Strength Index is calculated and how it can be used in conjunction with other technical analysis indicators, traders can gain a deeper understanding of an asset’s momentum and make more informed trading decisions.
Therefore, it is recommended to use RSI in combination with other technical and fundamental analysis tools and to adjust the parameters and thresholds of the indicator based on the specific market and time frame being analyzed. It is also important to manage risk and to have a disciplined trading plan that takes into account both potential profits and potential losses.