Fibonacci retracement is a popular technical analysis tool used in forex trading to identify potential levels of support and resistance. This tool is based on the Fibonacci sequence, a mathematical sequence where each number is the sum of the two preceding numbers, i.e., 0, 1, 1, 2, 3, 5, 8, 13, 21, 34, 55, 89, 144, and so on.
Fibonacci retracement is used to identify potential levels of support and resistance by drawing horizontal lines on a forex chart at the key Fibonacci levels of 23.6%, 38.2%, 50%, 61.8%, and 100%. These levels are calculated by dividing the vertical distance between a significant high and low by the key Fibonacci ratios.
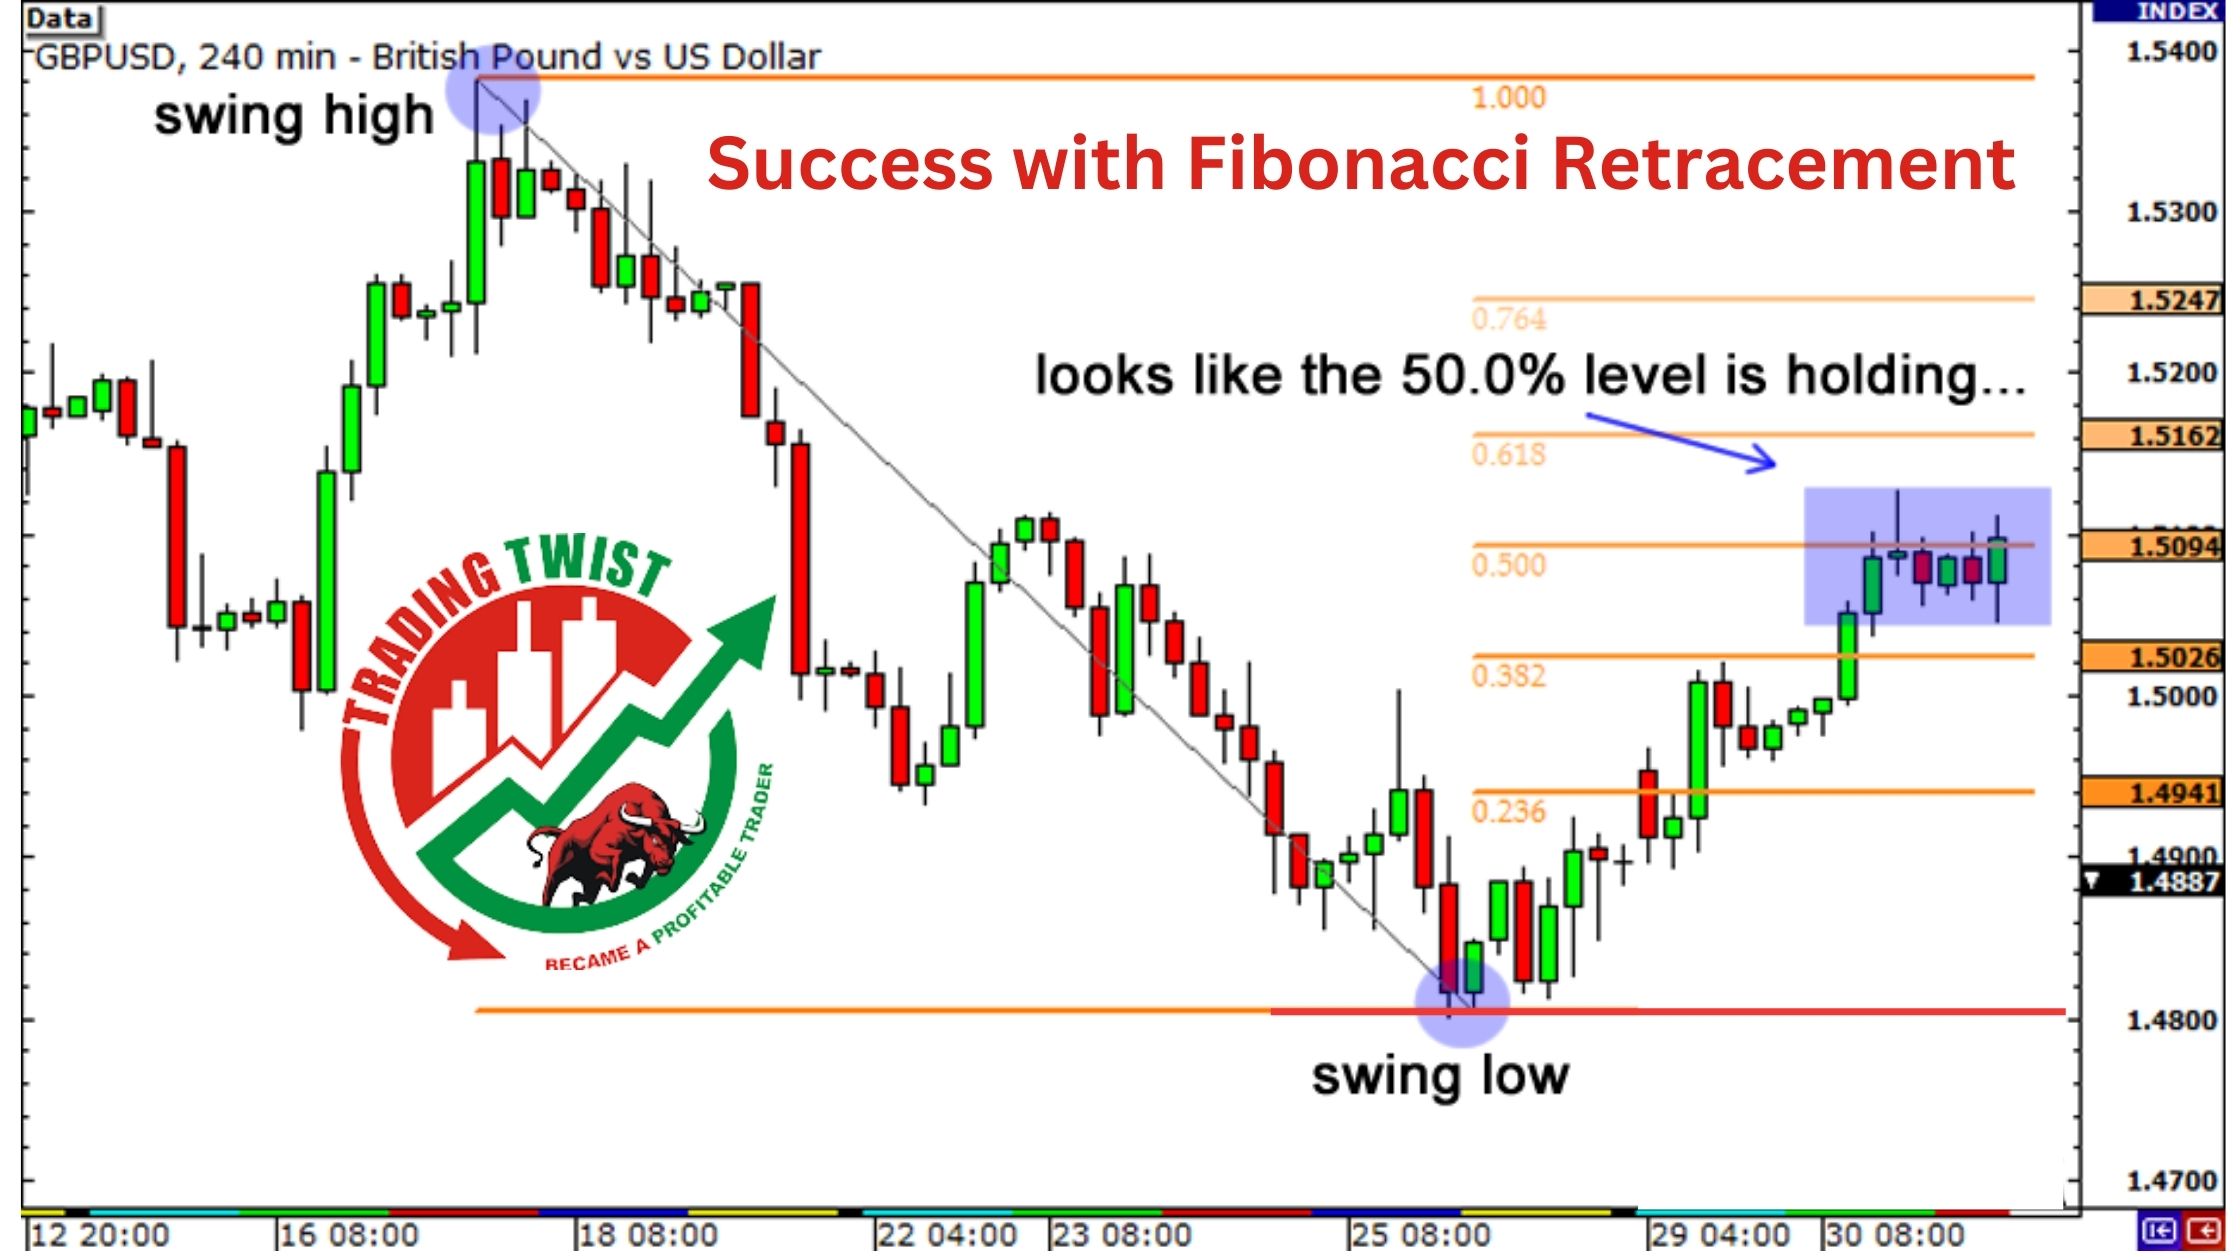
Using Fibonacci retracement to identify potential levels of support and resistance
Traders use Fibonacci retracement levels to identify potential buying or selling opportunities, as well as to set stop-loss and take-profit levels. When the price of a currency pair retraces to one of the Fibonacci levels, traders look for additional technical analysis to confirm whether the price will continue to move in the original direction or reverse.
To identify potential levels of support and resistance using Fibonacci retracement, traders need to follow a few steps:
- Identify a significant high and low point on the forex chart.
- Draw a trendline from the high point to the low point (or vice versa) to determine the direction of the trend.
- Draw horizontal lines at the key Fibonacci retracement levels of 23.6%, 38.2%, 50%, 61.8%, and 100%.
- Look for additional technical analysis such as candlestick patterns or indicators to confirm potential buying or selling opportunities at these levels.
It’s important to note that Fibonacci retracement levels should not be used in isolation, but rather as part of a comprehensive technical analysis strategy. Traders should also consider other indicators such as moving averages, candlestick patterns, and support and resistance levels when making trading decisions.
Combining with other technical analysis tools
Here are some other technical analysis tools that can be combined with Fibonacci retracement:
- Moving averages: Moving averages can help identify the direction of the trend and potential levels of support and resistance. When combined with Fibonacci retracement, moving averages can provide additional confirmation of potential buying or selling opportunities.
- Candlestick patterns: Candlestick patterns can provide insights into market sentiment and potential price reversals. Traders can use candlestick patterns in combination with Fibonacci retracement to confirm potential buying or selling opportunities at key levels.
- Support and resistance levels: Support and resistance levels are areas on the chart where the price has previously found support or resistance. When combined with Fibonacci retracement, support and resistance levels can provide additional confirmation of potential buying or selling opportunities.
- Oscillators: Oscillators such as the Relative Strength Index (RSI) and the Stochastic Oscillator can help identify overbought or oversold conditions in the market. When combined with Fibonacci retracement, oscillators can help confirm potential buying or selling opportunities at key levels.
It’s important to note that no single technical analysis tool is foolproof, and traders should always use multiple tools in combination to confirm potential buying or selling opportunities. By combining Fibonacci retracement with other technical analysis tools, traders can improve their chances of success in forex trading and make more informed trading decisions.
The importance of risk management when using Fibonacci retracement
While Fibonacci retracement is a powerful tool for identifying potential levels of support and resistance in forex trading, it’s important to remember that no trading strategy is foolproof. Risk management is crucial, as it can help traders minimize their losses and protect their trading capital.
Here are some tips for implementing effective risk management when using Fibonacci retracement:
- Set stop-loss levels: Stop-loss levels are predetermined levels at which a trade will be closed to limit losses. Traders can set stop-loss levels based on the key Fibonacci retracement levels to minimize potential losses.
- Use proper position sizing: Proper position sizing is important to ensure that potential losses are limited to a manageable amount. Traders should use position sizing based on their risk tolerance and account size to ensure that they are not risking too much on any single trade.
- Avoid overtrading: Overtrading can lead to losses and can be a sign of emotional trading. Traders should have a set number of trades per day or week to avoid overtrading and limit potential losses.
- Monitor market volatility: Market volatility can affect trading decisions and risk management. Traders should monitor market volatility and adjust their trading strategies accordingly to avoid unnecessary losses.
- Have a trading plan: A trading plan is essential for effective risk management. Traders should have a set plan for each trade, including entry and exit points, stop-loss levels, and profit targets.
Combining Fibonacci retracement with other technical analysis tools
For example, if a currency pair has been trending upwards and then retraces to the 38.2% Fibonacci level, traders may look for a bullish reversal pattern such as a hammer or bullish engulfing pattern to confirm a potential buying opportunity. Alternatively, if the currency pair breaks below the 50% Fibonacci level, traders may look for a bearish reversal pattern to confirm a potential selling opportunity.
It’s important to note that Fibonacci retracement levels should not be used in isolation, but rather as part of a comprehensive technical analysis strategy. Traders should also consider other indicators such as moving averages, candlestick patterns, and support and resistance levels when making trading decisions.
Conclusion: incorporating Fibonacci retracement into your Forex trading strategy
In conclusion, Fibonacci retracement is a powerful tool in forex trading that can help traders identify potential levels of support and resistance. By understanding the key Fibonacci levels and how to apply them to forex charts, traders can make more informed trading decisions and improve their chances of success in the market. However, it’s important to remember that no single tool or strategy guarantees profits in forex trading, and traders should always approach the market with caution and discipline.