
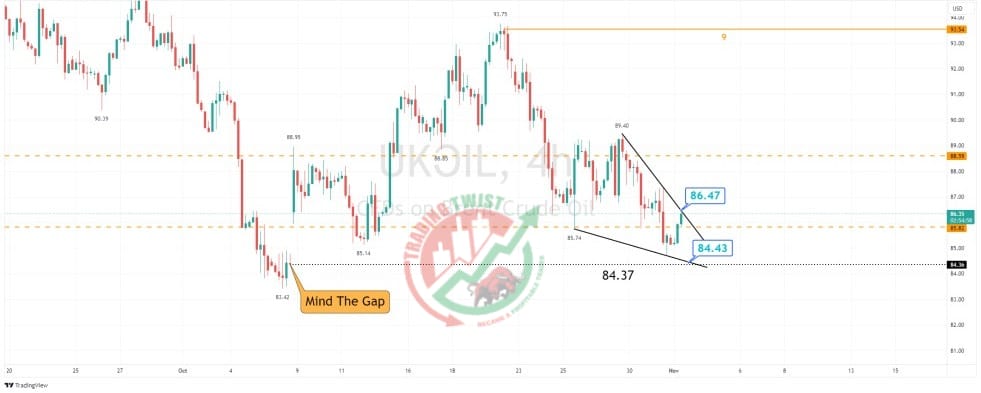
XTIUSD BRENT OIL Chart Technical Outlook – the 8-hour chart highlighted an ending wedge formation that had a measured move target of $85.14. This was achieved yesterday. The 4-hour chart highlights a bullish descending wedge formation. On a break of $86.47, the measured move target is $89.40. It should be noted that with the gap open of $84.37 from Friday, October 6, the preferred stance would be to buy into dips close to the trend of lower lows located at $84.43.


